A. Uniform Motion - Constant Speed - no acceleration
This is a typical graph of the relationship between position and time for an object moving at constant speed.
 By calculating the slope m of the position-time graph we obtain the velocity of the moving object
![]() Note that "m" is the slope of a straight line (of the form, y = mx + b) and it is constant.
Note that "m" is the slope of a straight line (of the form, y = mx + b) and it is constant.
The slope of this line (the average speed) can be calculated by several methods.
1. Slope Equation

2. Average speed equation

B. Uniformly Accelerated Motion - Variable Speed - Speed is not constant
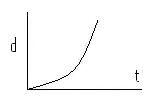
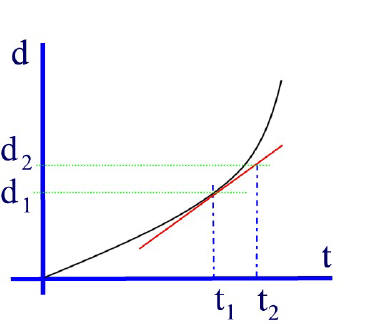
This graph illustrates the relationship between the position and the time for an object whose velocity is changing with time.
We know that the velocity is changing as time goes on because the slope of this line is not constant.
![]() This is a function of the form y = ax2 + bx + c. Distance increases in a non-linear fashion.
This is a function of the form y = ax2 + bx + c. Distance increases in a non-linear fashion.![]() To analyze this function mathematically one would need to take the first derivative of the equation using Calculus.
To analyze this function mathematically one would need to take the first derivative of the equation using Calculus.
At this stage we can still obtain a lot of information from this graph by using graphical analysis techniques.
1. Average velocity
To obtain the average velocity between two points in time (say t1 and t2) we can draw the secant line between these two points and calculate the slope of the secant line.
The slope of the secant line can be calculated by the usual method:
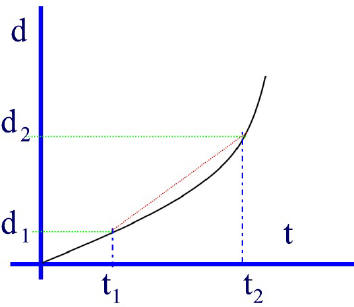
This gives us the average velocity between the time interval from t1 to t2
Therefore we can say that:
![]() vav (we used v to simplify) is the slope of the secant and it can also be calculated using the equation below:
vav (we used v to simplify) is the slope of the secant and it can also be calculated using the equation below:
2. Instantaneous Velocity
To obtain the instantaneous velocity, that is, the velocity at one instant (one point in time -- say t1), one must take the slope of the tangent line that touches the curve at that point (and that point only).
i.e. Vinst = slope of tangent
Vinst = v or:
![]() It is also important to note that the only time where the average speed (or velocity) and the instantaneous speed (or velocity) have the same value is at the "half time" point. Here the slope of the average secant line for the entire graph is the same as the slope of the tangent at the half time (t1/2) point as illustrated by the animation below. Here the half time occurs at 3s and at that point the average velocity for the whole 6s is equal to the instantaneous velocity at 3s.
It is also important to note that the only time where the average speed (or velocity) and the instantaneous speed (or velocity) have the same value is at the "half time" point. Here the slope of the average secant line for the entire graph is the same as the slope of the tangent at the half time (t1/2) point as illustrated by the animation below. Here the half time occurs at 3s and at that point the average velocity for the whole 6s is equal to the instantaneous velocity at 3s.
![]() Note how the secant for the entire graph is the same as the tangent at the half time point.
Note how the secant for the entire graph is the same as the tangent at the half time point.
 Click the play button to view animation.
C. Acceleration
1. Non-uniform Acceleration
Using a method similar to deriving velocity from distance-time graphs, we can obtain values of acceleration from velocity-time graphs.
The slope of the tangent to a v-t graph at a specific point in time (at an instant) will give the instantaneous acceleration.
2. Uniform Acceleration
If the acceleration is constant the v-t graph will be a straight line.
The slope of this line will give us the average acceleration.