Cooling Curves and Heating Curves
A cooling curve is a temperature-time graph taken of a substance as it is cooling and undergoing changes of state from a vapour to a solid.
Consider the cooling curve of water shown below.
Temperature is plotted on the y-axis and time on the x-axis.
As time goes on te temerature of a sample of water in a freezer starts to cool down and eventually freezes.
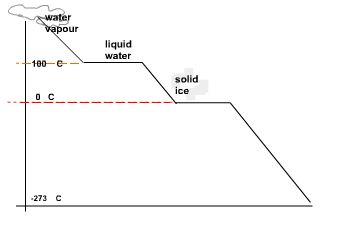
Water freezes at 00C.
To bring the motion of the water (ice) molecules to a complete stop the temperature needs to be dropped down to -273 0C.
This point is known as absolute zero or 0K (zero Kelvin).
On the Kelvin scale water boils at 373 K an freezes at 273 K.
Room temperature (200C.) is 293 K and STP (Standard Temperature) will have a reading of 298 K.
To convert from Celsius to Kelvin simply add 273 to the Celsius temperature.
Note that a change in Celsius temperature is equivalent to a change in Kelvin degrees.
For example from 200C. to 600C there is a temperature change of 400C..
This is the same amount of change in K.
Heating Curves
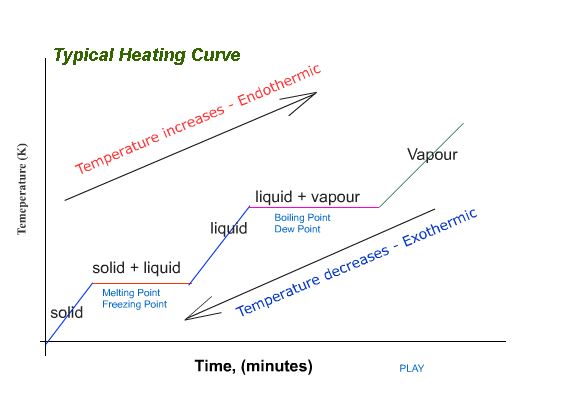
The reverse of a cooling curve is called a heating curve.
The reverse of a cooling curve is called a heating curve.
An example is hown below where a sample of ice (solid water) is gradually heated until it melts and eventually starts to boil.
Heating curves and cooling curves can explain what happens to a substance in terms of temperature changes, and heat content of the particles of the substance when they undergo changes of state from solid, to liquid, to gas (vapour state) and vice versa. An exothermic process is a process that produces heat while an endothermic process will require the addition of heat to proceed.
Exercise #1:
1. Change the following in K temperatures:
a) 2 0C = _________________ K
b) -132 0C = ______________ K
2. Change the following in 0C
a) 100 K = __________________0C
b) 30 K = _________________ 0C
c) 500 K = _________________ 0C